

Infographics
We are surrounded by information delivered in words, but not all of it is easy to understand or absorb. I enjoy using design to create visuals that organise that content in a way that helps people quickly understand what matters, bringing the data and ideas to life. Whether it’s a report, educational resource or presentation, I help turn complex information into clear, engaging and accessible communications that people can quickly and easily navigate and understand.
Clear Filters

Cyber security

What does the Solicitor do for the Buyer?

BBB Impact report
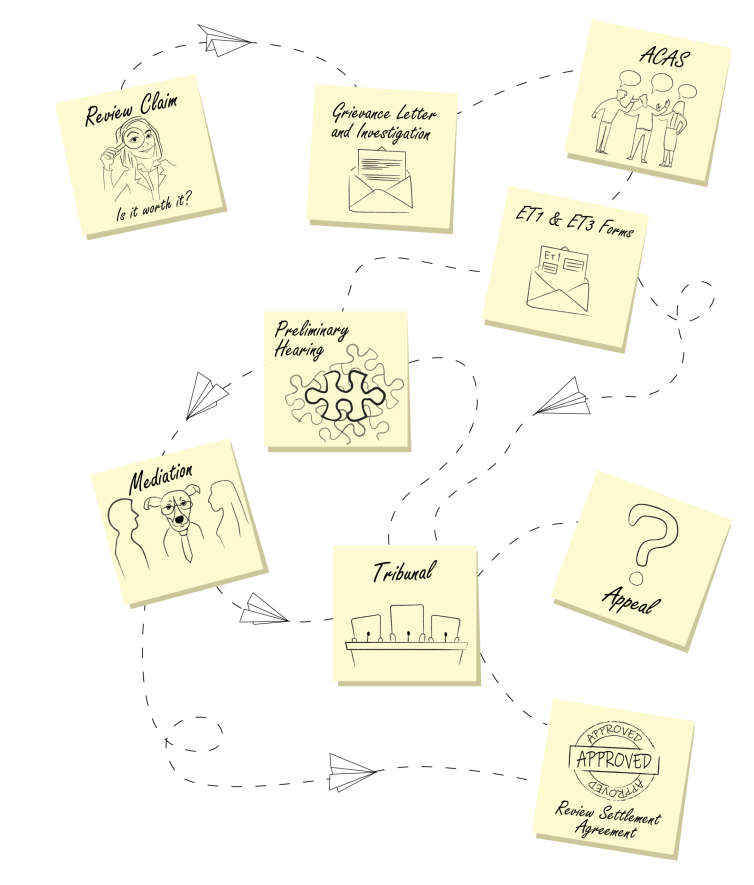
Employment Tribunal Process

Van chooser infographic
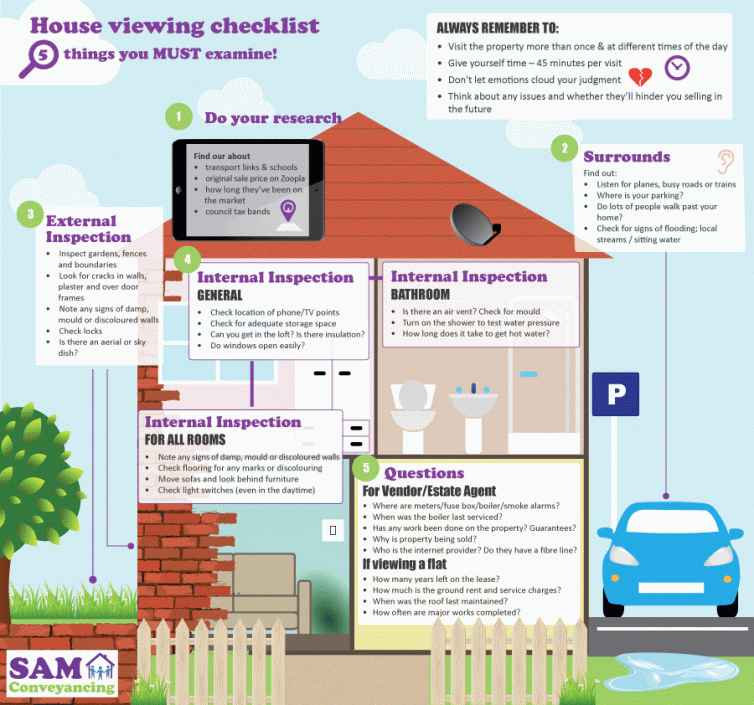
House viewing checklist

Money transfer infographic

How Green Is Your Borough

Helping businesses tackle climate change

Property
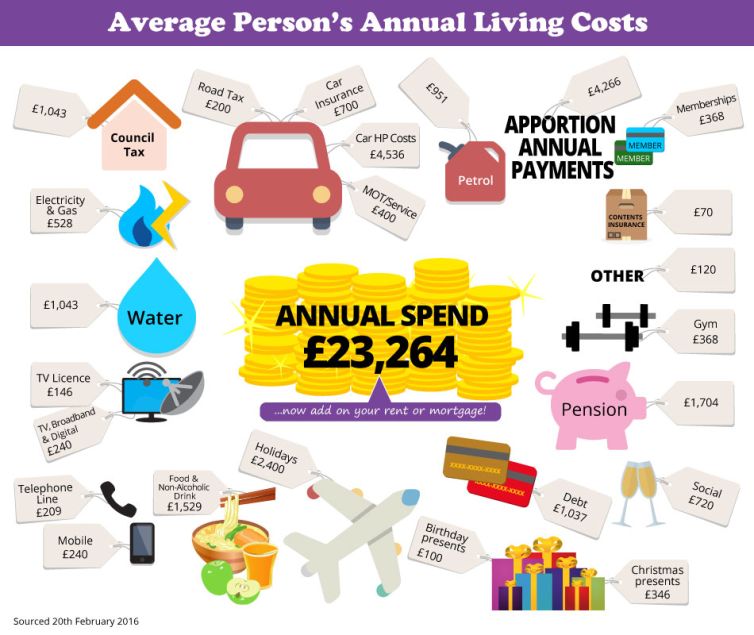
Average yearly spend